Contents
- Instrument control
- Detectors and energy range
- Performance and calibration
- Beam intensity and noise measurements
- Beamline performance and calibration
Instrument control
The Hyperion 2000 microscope and V80v spectrometer are controlled via Bruker OPUS software, version 6.5. This controls data acquisition, sample stage position and automated data collection including multipoint grid mapping. An online user manual is available at the beamline.
The offline Hyperion 3000 microscope with Focal Plane Array (FPA) detector and V70 spectrometer are controlled by OPUS software, version 7.0. Again an online user manual is available at the beamline.
Detectors and energy range
Two single-point detectors are currently available for use with the Hyperion 2000 microscope. Most measurements are conducted using a narrow-band, high sensitivity, liquid nitrogen cooled Mercury Cadmium Telluride (MCT) detector. It is currently optimised for a wavelength range of 3800-700 cm-1; the high wavenumber range can be extended to 6000 cm-1 if required. A wide-band MCT detector is also available and extends the far IR detection range beyond that of the narrow-band detector but with a 10x loss of sensitivity. Please see our FAQ page for more information.
- Narrow Band (50 micron detector element); low wavenumber limit 700 cm-1
- Wide Band (100 micron detector element); low wavenumber limit 550 cm-1
The offline Hyperion 3000 microscope is equipped with a 64x64 pixel Focal Plane Array (FPA) detector; wavenumber range 3800-900 cm-1. This allows users to collect large overview IR images from their samples prior to high-resolution mapping using the beamline instrument.
Beam intensity and noise measurements
The beam intensity of a defined focus size on a sample and the observed baseline noise are recorded below. Typical noise values measured in reflectance with details of the measurement conditions given. The noise is assessed in two 100 cm-1 regions as a %T spectrum calculated from two sequential “single beam” spectra collected under identical conditions.
- Reference and sample = Gold mirror
- Beam defining aperture = 5 × 5 microns at sample
- Detector = Narrow-band MCT 50 micron element
- Acquisition speed = 40 kHz
- Number of scans = 128 averages
- Apodisation = Beckmann-Harris
- Zero filling = 2 levels
| 2450-2550 cm-1 | 1190-1290 cm-1 |
|
| % noise | 0.02 |
0.05 |
Beamline performance and calibration
Beamline calibration is undertaken by the staff in advance of users’ experiments, or following a change of beamline configuration during an experiment (e.g. from reflectance to ATR).
Spatial Resolution
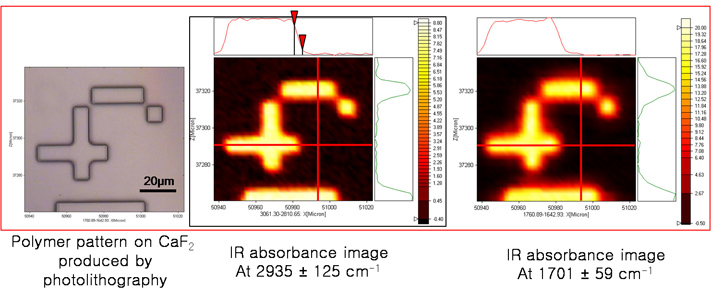
Spatial resolution has been assessed using custom test targets consisting of polymeric patterns deposited on either IR reflecting or IR transmitting substrates. An example image recorded in transmission is shown in fig. 1. This clearly demonstrates a spatial resolution of 3 microns, as illustrated by the sharp edge profile of the IR absorbance between the two red arrows at 2935 cm-1.
|
|
|
Figure 1. A demonstration of the achievable spatial resolution using the Hyperion 2000 IR microscope: a) Polymer pattern on calcium fluoride produced by photolithography; b) FTIR chemical map showing an absorbance image integrated over 2935±125cm-1; c) FTIR chemical map integrated over 1701±59cm-1. FTIR experimental conditions: 3x3 micron aperture, 2 micron step size, 4 cm-1 resolution.
|
Signal-to-Noise Comparison
The signal-to-noise ratio is significantly improved by the use of the synchrotron source over a conventional lab-based mid-IR source, e.g. Globar. Fig. 2 shows an approx. 20-40 fold improvement in the signal-to-noise when using the synchrotron source.
 |
|
Figure 2. A comparison of the signal-to-noise recorded for the CH stretch absorption bands from a 5 mm spot on a biological tissue sample between the synchrotron and a conventional mid-IR source. FTIR spectral conditions: 128 averaged scans, 5x5 micron aperture, 4 cm-1 resolution.
RMS% noise @ 2550-2450 cm-1
Synchrotron 0.02-0.04%
Globar 0.8%
|