Technical Information - MX1: Macromolecular Crystallography beamline(formerly known as the High-Throughput Protein Crystallography Beamline) |
|
|
Source |
03BM1 (dipole/bending magnet) |
|
Energy Range |
5 - 19 keV |
|
Optimal Energy Range |
6 - 16 keV |
|
Nominal beam size at sample |
130 x 90 micrometres |
| Flux at 12.6keV |
1.5 x 10¹¹ photons/sec |
|
Harmonic content at 5 - 20 keV |
< 0.1% |
Technical Information - MX2: Micro Crystallography beamline(formerly known as the Micro Protein Crystallography Beamline) |
|
|
Source |
03ID1 (3m in-vacuum undulator) |
|
Energy Range |
5.5 - 28 keV |
|
Optimal Energy Range |
5.5 - 27 keV |
|
Nominal beam size at sample |
37 x 32 micrometres |
| Flux at 12.6keV |
4 x 10¹² photons/sec |
|
Harmonic content at 5 - 20 keV |
< 0.1% |
Instrument Control
Front-end optics controlled via Oxford-Danfysik GUI.
End-station control via Blu-Ice GUI.
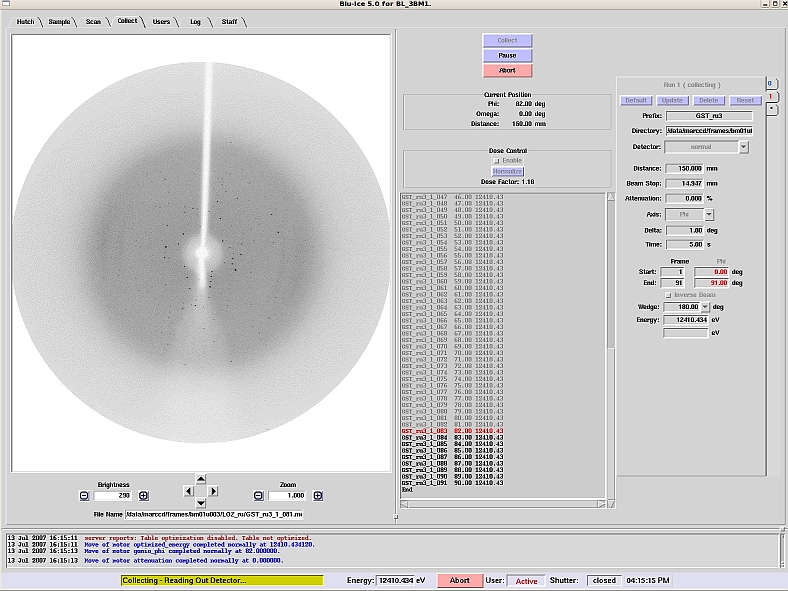
The Blu-Ice interface includes:
- Camera views which enable hutch monitoring plus user-friendly crystal centering
- Staff-assisted temperature control of crystals when mounted on the gonio via a Cryojet sample cooler (490 – 90K). This feature can be used in conjunction with both manual and automated crystal mounting procedures
- easy input of data collection parameters plus ability to store runs
- remote detector movement and shutter control
- fully remote data collection when used in conjunction with SAM robotic sample loader
The excitation scan is useful in identifying and verifying the presence of anomalous scatterers in the sample. The energy (MAD) scans are used to select the appropriate wavelengths for anomalous dispersion experiments (optimised SAD and MAD). The MAD ‘scan mode’ in the Blu-Ice interface can be used to scan the x-ray energy against the fluorescence emitted by the sample and subsequently determine the optimal energies for MAD data collection.
Further information on running the Blu-Ice software, plus hints and tips, can be found in both the User Manual and the Remote Access Manual in the Resources webpage for this beamline.
Detectors - MX1: Macromolecular Crystallography Beamline
ADSC Quantum 210r Detector:
- 210 × 210 mm large area detector
- 16.8 megapixels
- 100 micron pixel size
- Controlled externally via Blu-Ice user interface
- Detector range off sample: 85 – 865 mm
- Detector readout time: 0.31 seconds
Amptek CR100XR Pin diode detector:
- controlled externally via Blu-Ice user interface
- excitation energies from 5.5 to 18keV
Detectors - MX2: Micro Crystallography Beamline
ADSC Quantum 315r Detector:
- 315 × 315 mm large area detector
- 37.8 megapixels
- 100 micron pixel size
- Controlled externally via Blu-Ice user interface
- Detector range off sample: 116 – 950 mm
- Detector readout time: 0.31 seconds
Si Vortex-ES Si drift detector:
- controlled externally via Blu-Ice user interface
- excitation energies from 5.5 to 18keV
Beamline Calibrations
Energy/Wavelength
Energy is calibrated by scanning zinc and platinum foils that are permanently mounted in the beamline. Output data is processed to determine the location of the peak energy and this information is used to calibrate the Bragg setting (the pitch of the first monochromator crystal).
Flux
The energy is set at 12.658keV, then a calibrated photodiode is placed at the sample position to measure photon flux (photons/sec).
Focus Size and Stability
Beam size is measured/monitored using Areavision and a Ce-/Nd-doped Yttrium Aluminium Garnet (YAG) crystal at a fixed attenuation.
Apparatus Geometry
Immediately following an energy/wavelength calibration, samples of known unit cell dimensions (e.g. trypsin or insulin) are used to calibrate the distance between sample spindle axis and the face of the detector.
Robot Geometry
An internal calibration routine is performed periodically to set the robot arm positions at key axes of movement. Sample mounts can then be picked accurately from the cassettes in the robot dewar and placed onto the goniometer head.
Data Quality
Analysis of at least 3 protein crystals (of known unit cell dimensions, such as trypsin and insulin) are used to confirm the Rmerge value (where Rmerge must be less than or equal to 8.0% overall and less than or equal to 20% at 2.0 angstroms).
EPS
Drift of flowmeters and thermocouples are checked periodically for changes in flow or temperature (comparison made with electronically archived values).


